AI Chart Analysis · Beta
Ask the Trading AI.
Get the full picture.
Ask about any market – Bitcoin, Tesla, Gold, EURUSD. You get chart snapshots for short, mid and long term, the key facts, clear scenarios – and whether the setup matches your own trading rules.
Facts and scenarios – no buy/sell signals, no price targets, not financial advice.
 Trading AI
Why it’s different
Not another “AI signal” bot.
Three timeframes, one answer
Every report shows short, mid and long term side by side – with chart snapshots taken the moment you ask.
Facts are calculated, not guessed
Trend, moving averages, volatility and key levels are computed from market data. The AI explains them in plain words – it doesn’t invent numbers.
Checked against YOUR rules
Save your trading plan once. Every report shows which of your own rules a setup meets – the feature generic AI chats don’t have.
Connected to your journal
Log the idea in one click and see later what your analyses were really worth – in your own numbers.
Example report
This is what you get.
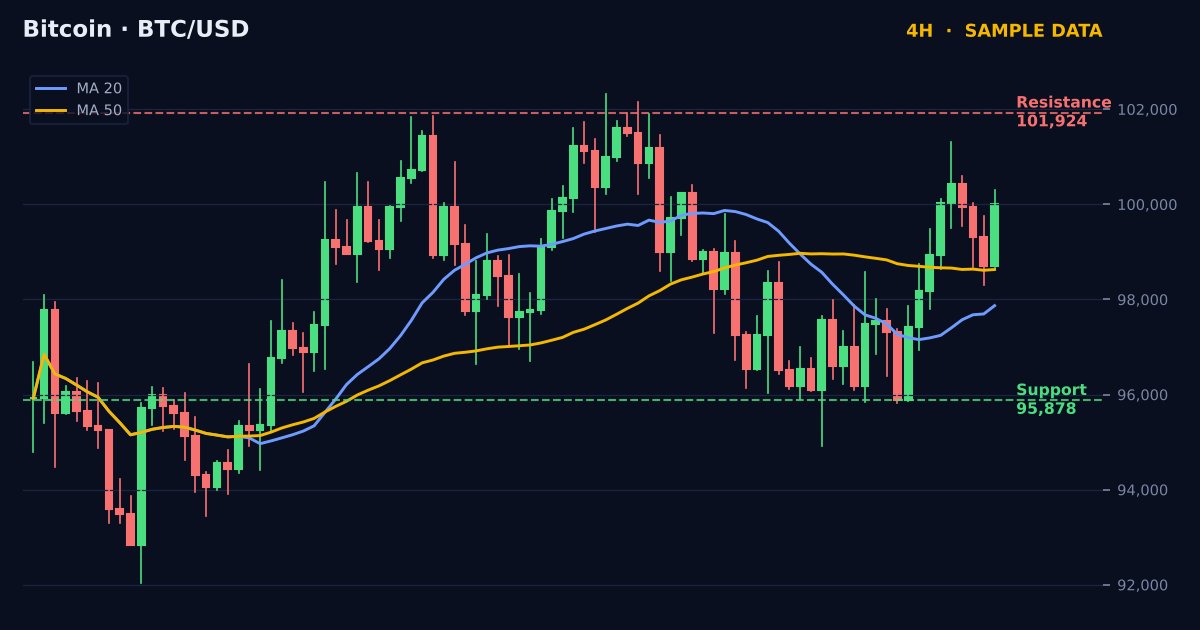
A break above 101,920 would resolve the range to the upside.
A close below 95,880 would break the range to the downside.
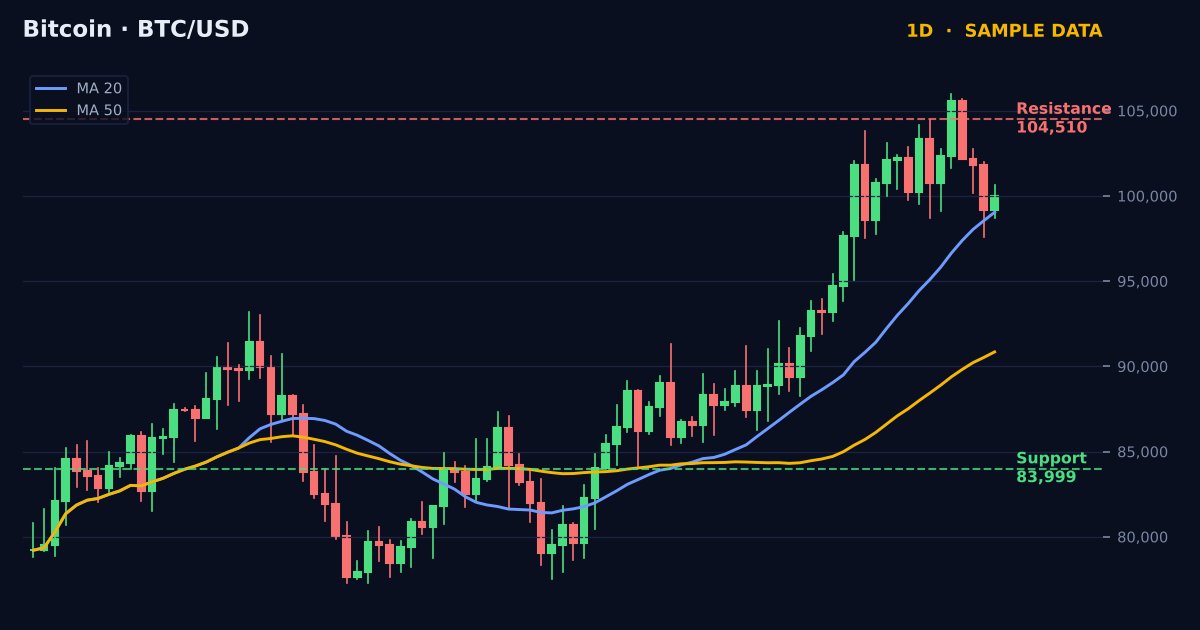
Reclaims 104,510: the daily trend resumes from a new high.
Loses 84,000: the daily uptrend is invalidated.
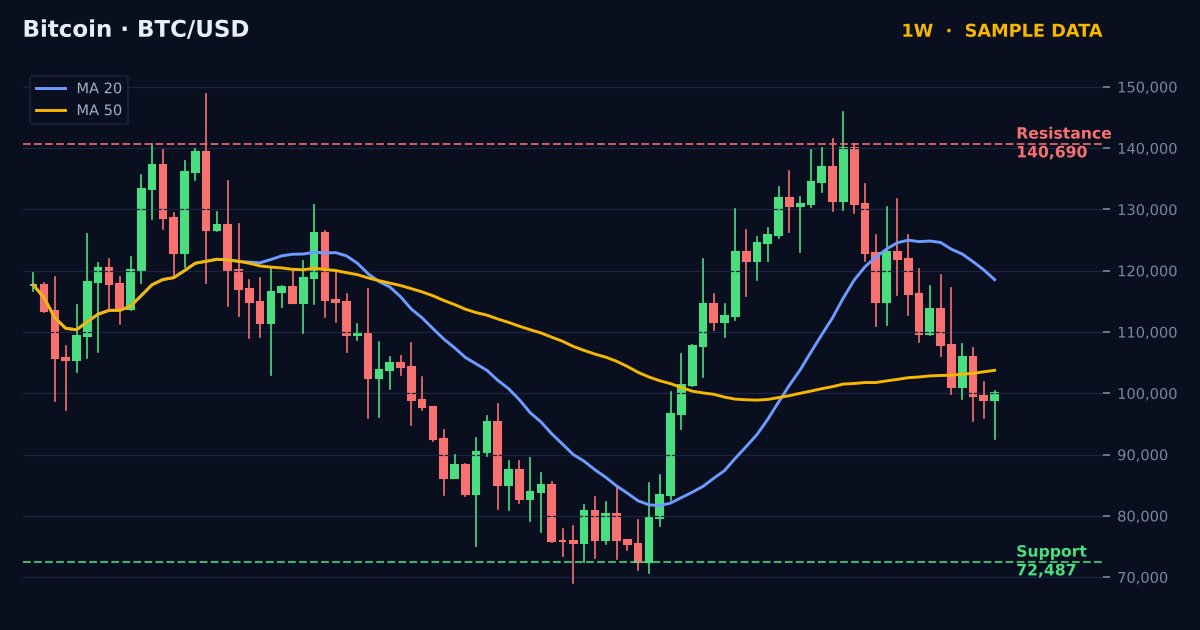
Weekly closes back above the MA 50 would mark the end of the correction.
Weekly closes below 72,490 would end the long-term uptrend.
How this report is made: facts are calculated automatically from market data at the time of the request (moving averages, ATR volatility, swing-based support/resistance). Scenarios are conditional “if–then” descriptions, not predictions. This is not a recommendation to buy, sell or hold any instrument and not financial advice. Disclosure: Trading Performance Pro and its team may hold positions in instruments covered.
How it works
Ask in plain words
“How does Bitcoin look?”, “Tesla long term?”, “Gold this week?” – no symbols or settings needed.
Get 3 snapshots + facts
Short-, mid- and long-term charts with trend, structure, volatility and key levels.
Read scenarios & plan check
Bull and bear scenario per timeframe – and which of your own rules the setup meets.
Facts, not signals.
We built the Trading AI to make you a better trader – not to tell you what to buy.
- No buy / sell / hold calls
- No price targets or “probabilities”
- Facts and opinions clearly separated
- Every report time-stamped with its method
- Questions like “should I buy?” are redirected to your own rules
Pricing
Start free. Pay only if it helps.
1 report = 1 market, all 3 timeframes + follow-up questions.
Credit packs
$910 reports · or 30 for $19- Credits never expire
- No subscription
- Report history saved
Pro
$14.99/mo100 reports per month · or $119/year- Multiple plans & strategies
- Watchlist with daily snapshots
- Journal sync · cancel anytime
Beta pricing. Payments start with the public launch – beta members are invited first.
FAQ
Is this financial advice?
No. The AI describes what the chart shows and checks it against your own rules. It never tells you to buy, sell or hold. All decisions are yours.
Which markets can I ask about?
Major crypto, US and European stocks, indices, forex pairs and commodities like gold and oil.
Where do the numbers come from?
Facts are calculated automatically from market data at the moment you ask. The AI only explains them – it doesn’t make numbers up.
When can I use it?
The beta opens in waves. Reserve your spot with your email and you get your access link as soon as it’s ready.
Reserve your 3 free reports
Join free with your email – you get the free trading plan right away (it powers the plan check) and your beta invite as soon as it’s ready.